This section describes how to download, configure, build and execute
the supported use cases.
Note
You can copy all command examples on this page from the HTML document format
by clicking the copy button.
In the PDF document format, be aware that special characters are added when
lines get wrapped.
Follow the Yocto Project documentation on
how to install the essential packages required for the build host. The
packages needed to build the Yocto Project documentation manuals are not
required.
Set up pipx to install Python tools in isolated environments:
sudo apt install pipx
pipx ensurepath
After running the above commands, restart your shell or run
source~/.bashrc to ensure that the pipx binary path is added to your
shell’s PATH.
Install the kas tool and its optional dependency (to use the “menu” plugin):
Performing the builds and FVP execution in a tmux session is mandatory for
Arm Zena CSS because the runfvp tool that invokes the FVP expects
the presence of a tmux session to attach its spawned tmux windows for console
access to the processing elements.
Refer to Tmux Documentation for more information on the usage of tmux.
It is recommended to change the default history-limit by adding
set-option-ghistory-limit3000 to ~/.tmux.conf before starting
tmux.
Start a new tmux session, via:
tmux new-session -s arm-auto-solutions
To reconnect to an existing tmux session:
tmux attach -t arm-auto-solutions
Download the Arm Zena CSS repository using Git and checkout the
release, via:
mkdir -p ~/arm-auto-solutions
cd ~/arm-auto-solutions
git clone https://git.gitlab.arm.com/automotive-and-industrial/arm-auto-solutions/arm-zena-css.git --branch v2.2
kas checkout arm-zena-css/yocto/kas/repos.yml
This section explains different supported use cases and how to reproduce them.
For FVP builds, the software can be built for two different platform
configurations - CFG1 and CFG2. RTL is described later in this section. See
Configurations
for more information.
The Safety Island Cluster 1 (SI CL1) is present only in the FVP CFG2 variant.
The tmux window for SI CL1 terminal_uart_si_cluster1 only appears when
the CFG2 variant is selected during the build configuration.
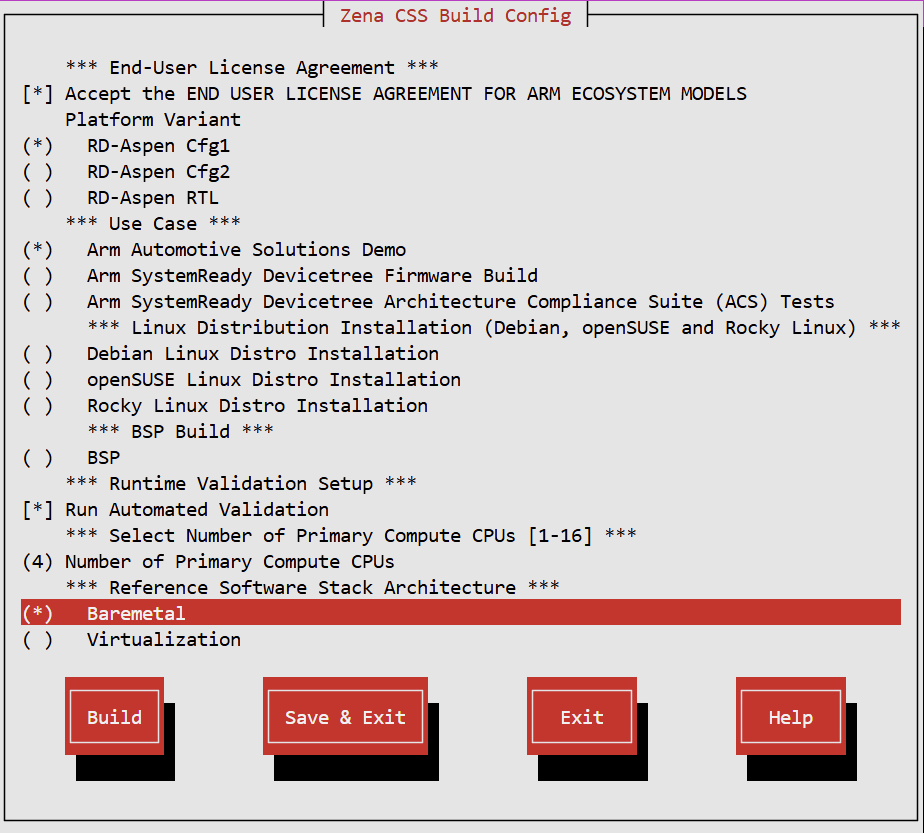
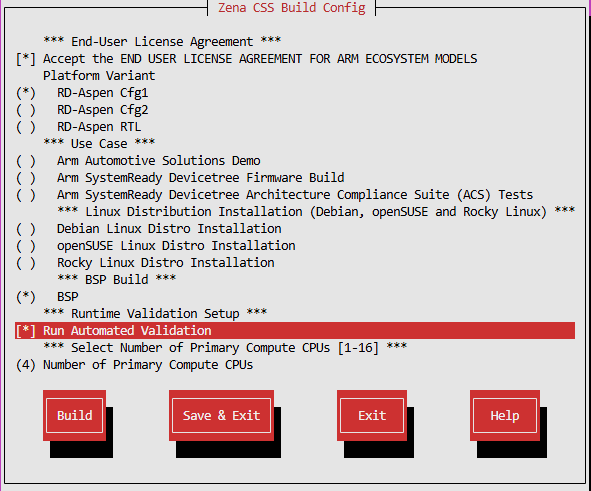
Run the following to open the configuration menu:
kas menu arm-zena-css/Kconfig
To build and run any image for an Arm FVP the user has to accept its
EULA by selecting the corresponding configuration
option in the build setup and pressing spacebar.
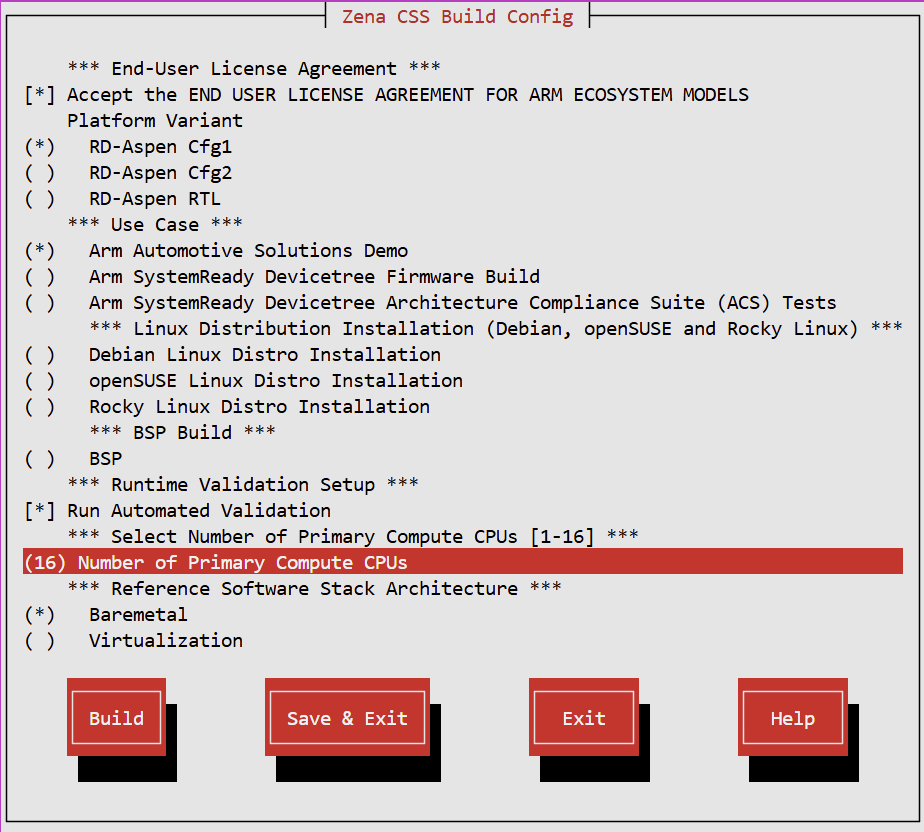
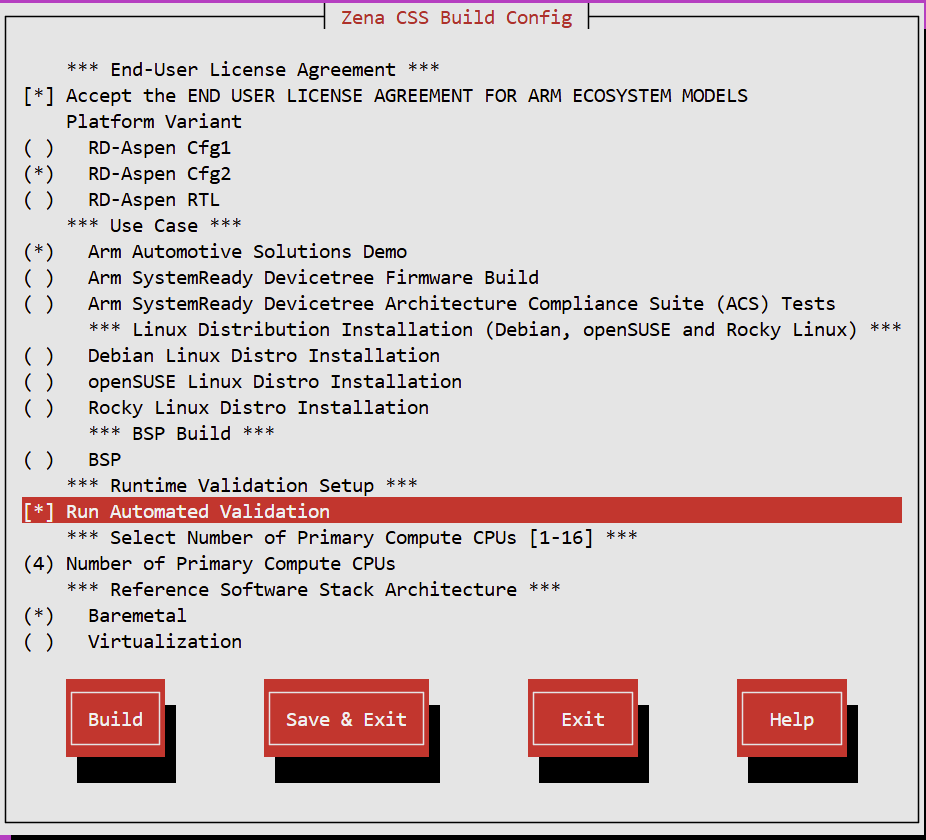
The default number of Primary Compute CPUs is 4. The user can change this
by selecting a value between 1 and 16 from the
NumberofPrimaryComputeCPUs option. And also the default Platform variant
is RD-AspenCFG1. The user can change this to RD-AspenCFG2 by selecting the
PlatformVariant option.
To start the build, press the right arrow key, select the Build option and
press enter. Subsequent builds with the same configuration can be started by
running:
kas build
Note
Typically, the build process should complete without any interruptions.
However, if it is manually interrupted (e.g., by pressing Ctrl-c) or due
to network/resource failures, errors may occur when rerunning the build,
such as:
NOTE: Reconnecting to bitbake server...
NOTE: No reply from server in 30s (for command <command> at 10:11:08.527092)
This happens because some processes might still be running in the background.
To resolve this, you can manually terminate them using: killall-eCooker
Check for lock files and ensure there are no leftover lock files from the
previous build. You can locate and remove them with:
find.-name"bitbake.lock"-execrm-f{}\;
If the above steps don’t resolve the issue, a system reboot might help clear
any lingering problems.
FVPs, and Fast Models in general, are functionally accurate, meaning that they
fully execute all instructions correctly, however they are not cycle accurate.
The main goal of the Reference Software Stack is to prove functionality only,
and should not be used for performance analysis.
The runfvp tool that invokes the FVP creates one tmux terminal
window per processing element. The default window displayed will be that of the
Primary Compute terminal, titled terminal_ns_uart0. You
may press Ctrl-bw to see the list of tmux windows and use arrow keys to
navigate through the windows and press Enter to select any processing
element terminal.
The following table lists the different tmux panes and their purpose:
During boot and runtime the user shall never issue more than two Ctrl-c,
since it might corrupt the images and prevent successful reboot of the
Arm Zena CSS FVP. In this eventuality, it can be re-generated by issuing
kasshell-c"bitbakefirmware-fvp-rd-aspen-Cdeploy"
In some cases, pressing Ctrl-c while the system is writing back to the
flash might corrupt the images, resulting in an error during boot.
If this happens, rebuilding the images with the following command will resolve the issue:
kasshell-c"bitbakefirmware-fvp-rd-aspen-Cdeploy"
To start the FVP and run the software reference stack:
kas shell -c "../layers/meta-arm/scripts/runfvp -t tmux --verbose"
Ensure that the tmux window titled terminal_ns_uart0 is selected.
If not, press Ctrl-bw from the tmux session, navigate to the tmux
window titled terminal_ns_uart0 followed by pressing the Enter key.
Wait for the system to boot and for the Linux prompt to appear.
The Reference Software Stack running on the Primary Compute can be logged into
as the root user without a password in the Linux terminal.
Note
RD_ASD in the FVP logs refers to Reference Design – Automotive System Design,
a generic term referring to Zena-CSS.
To shut down the FVP and terminate the emulation, select the terminal titled
python3 where the runfvp was launched by pressing Ctrl-bw and press
Ctrl-c to stop the FVP process.
In general, it is not necessary to rebuild the Arm Automotive Solutions Demo
for each use case, and it is not required to shut down and relaunch the FVP for
every use case.
See the following instructions for building images for BSP, Baremetal and
Virtualization architectures.
The BSP use case builds the minimal Arm Zena CSS Linux software stack required
to boot the platform into Linux for bring-up and validation. It uses the
nodistro configuration and generates the core-image-minimal image. It
does not enable the Arm Automotive Solutions demo packages or
virtualization-specific software.
If the FVP has already been launched with the specified build configuration and
is connected to the Primary Compute terminal (running Linux), there is no need
to stop and relaunch. For first-time launch, follow the instructions below.
To start the FVP and connect to the Primary Compute terminal:
kas shell -c "../layers/meta-arm/scripts/runfvp -t tmux --verbose"
Wait for the system to boot and for the Linux login prompt to appear, then log
in with the username root without password.
When the Linux login prompt appears, the BSP boot flow has completed.
The BSP image provides the base platform boot flow and Linux shell environment
only. It does not include the Arm Automotive Solutions demo applications or the
virtualization software stack.
If the Arm Automotive Solutions Demo for the Baremetal Architecture is the most
recent build, there is no need to rebuild. For a first-time build, follow the
instructions below.
To configure and build a Baremetal Architecture image see Kas build.
If the FVP has already been launched with the specified build configuration and
is connected to the Primary Compute terminal (running Linux), there is no need
to stop and relaunch. For first-time launch, follow the instructions to
start the FVP and connect it to the Primary Compute terminal.
To start the FVP and connect to the Primary Compute terminal:
kas shell -c "../layers/meta-arm/scripts/runfvp -t tmux --verbose"
Wait for the system to boot and for the Linux prompt to appear.
The Reference Software Stack running on the Primary Compute can be logged into
as root user without a password in the Linux terminal. Run the below command
to ensure that all the expected services have been initialized:
systemctl is-system-running --wait
Wait for it to return. The expected terminal output is running.
Run the PSA Crypto API tests from the Primary Compute terminal using the
following command:
psa-crypto-api-test
A message similar to the following will appear when the tests have
completed:
************ Crypto Suite Report **********
TOTAL TESTS     : 60
TOTAL PASSED    : 57
TOTAL SIM ERROR : 0
TOTAL FAILED    : 0
TOTAL SKIPPED   : 3
******************************************
Run the PSA Protected Storage API tests from the Primary Compute terminal
using the following command:
psa-ps-api-test
A message similar to the following will appear when the tests have
completed:
************ Storage Suite Report **********
TOTAL TESTS     : 17
TOTAL PASSED    : 11
TOTAL SIM ERROR : 0
TOTAL FAILED    : 0
TOTAL SKIPPED   : 6
******************************************
Run the PSA Internal Trusted Storage API tests from the Primary Compute terminal
using the following command:
psa-its-api-test
A message similar to the following will appear when the tests have
completed:
************ Storage Suite Report **********
TOTAL TESTS     : 10
TOTAL PASSED    : 10
TOTAL SIM ERROR : 0
TOTAL FAILED    : 0
TOTAL SKIPPED   : 0
******************************************
Run the PSA Initial Attestation API tests from the Primary Compute terminal
using the following command:
psa-iat-api-test
A message similar to the following will appear when the tests have
completed:
************ Attestation Suite Report **********
TOTAL TESTS     : 1
TOTAL PASSED    : 1
TOTAL SIM ERROR : 0
TOTAL FAILED    : 0
TOTAL SKIPPED   : 0
******************************************
Note
There is no need to shut down and relaunch the FVP before demonstrating another
use case on the Arm Automotive Solutions Demo build (Baremetal Architecture).
To shut down the FVP and terminate the emulation automatically, issue the
following command on the Primary Compute terminal:
shutdown now
The below messages show that the shutdown process is complete:
[  OK  ] Finished System Power Off.
[  OK  ] Reached target System Power Off.
reboot: Power down
SCP-firmware provides a built-in debugger CLI that can be used to run
integration tests on the Safety Island firmware. This is especially useful
for validating fault-handling logic and verifying module-specific behavior
in isolation.
To trigger the SMCF integration test and enable SMCF sample data logging:
Switch to the tmux pane SICL0-terminal_uart_si_cluster0.
Enter the SCP-Firmware debugger CLI using Ctrl-e.
At the > prompt, run the following command:
testsmcf
Exit the CLI using Ctrl-d. This resumes normal firmware execution.
If the procedure completes successfully, the terminal prints a PASS message
and then starts logging SMCF sample data at regular intervals in the
terminal_uart_si_cluster0 console.
Note
The SI CL0 console keeps printing sample data continuously after the test
completes. This is expected behavior.
The PASS message indicates that logging is enabled. It does not validate
data correctness. Sample values change each period because the data is randomly
generated.
Example output:
[CLI_DEBUGGER_MODULE] Entering CLI
> test smcf
[CLI_DEBUGGER_MODULE] Exiting CLI
[    0.823712] [INTEGRATION_TEST] Start: smcf
[    0.823719] [TEST_SMCF] Set SMCF print to on
./module/integration_test/src/mod_integration_test.c:111:test_smcf:PASS

-----------------------
1 Tests 0 Failures 0 Ignored
OK
[    1.359134] [SMCF_CLIENT] Values for MGI MGI_SMD_SMCF_MGI MLI 0 (Sensor)
[    1.359145] [SMCF_CLIENT] Value[0] data = 0x6b
[    1.359153] [SMCF_CLIENT] Value[1] data = 0xdc
[    1.359161] [SMCF_CLIENT] Value[2] data = 0x1
[    1.359168] [SMCF_CLIENT] Value[3] data = 0x5a
[    1.359174] [SMCF_CLIENT] Value[4] data = 0xce
[    1.359183] [SMCF_CLIENT] Value[5] data = 0x50
[    1.359190] [SMCF_CLIENT] Value[6] data = 0x3a
[    1.359198] [SMCF_CLIENT] Value[7] data = 0xcc
[    1.359205] [SMCF_CLIENT] Value[8] data = 0xde
[    1.359212] [SMCF_CLIENT] Value[9] data = 0x1
[    1.359220] [SMCF_CLIENT] Value[10] data = 0xfd
[    1.359227] [SMCF_CLIENT] Value[11] data = 0x8d
[    1.359236] [SMCF_CLIENT] Values for MGI MGI_AP_CLUSTER_MGI_0 MLI 0 (AMU)
[    1.359246] [SMCF_CLIENT] Value[0] data = 0x38
...
[    1.359327] [SMCF_CLIENT] Value[11] data = 0x9e
[    1.359336] [SMCF_CLIENT] Values for MGI MGI_AP_CLUSTER_MGI_1 MLI 0 (AMU)
[    1.359346] [SMCF_CLIENT] Value[0] data = 0x29
...
[    1.359428] [SMCF_CLIENT] Value[11] data = 0xa5
[    1.359437] [SMCF_CLIENT] Values for MGI MGI_AP_CLUSTER_MGI_2 MLI 0 (AMU)
[    1.359446] [SMCF_CLIENT] Value[0] data = 0xe9
...
[    1.359528] [SMCF_CLIENT] Value[11] data = 0x5f
[    1.359537] [SMCF_CLIENT] Values for MGI MGI_AP_CLUSTER_MGI_3 MLI 0 (AMU)
[    1.359547] [SMCF_CLIENT] Value[0] data = 0xc3
...
[    1.359628] [SMCF_CLIENT] Value[11] data = 0xb1
Platform Fault Detection Interface (PFDI) in Primary Compute
The Software Reference Stack currently supports the
Platform Fault Detection Interface (PFDI) Specification, which is used to detect hardware
faults by registering appropriate firmware test libraries. The PFDI TF-A runner
is implemented based on the Beta version of this specification.
Software Reference Stack uses dummy PFDI firmware unless the Arm Software
Test Libraries (STL) are used. This STL can be integrated as the real PFDI
firmware test backend. To enable STL support and obtain access, please contact
Arm or visit Arm Software Test Libraries.
Run the configuration menu:
kas menu arm-zena-css/Kconfig
Select PlatformVariant > RD-AspenCFG1 or RD-AspenCFG2
Select UseCase > ArmAutomotiveSolutionsDemo.
Select Build.
After the build process is complete, to start the FVP and run the
software reference stack:
kas shell -c "../layers/meta-arm/scripts/runfvp -t tmux --verbose"
Ensure that the tmux window titled terminal_ns_uart0 is selected.
If not, press Ctrl-bw from the tmux session, navigate to the tmux
window titled terminal_ns_uart0 followed by pressing the Enter key.
Wait for the system to boot and for the Linux prompt to appear.
The Reference Software Stack running on the Primary Compute can be logged into
as root user without a password in the Linux terminal.
A systemd service which runs the PFDI in the background is started automatically.
Run the following command to check the status of the PFDI service:
systemctl status pfdi-app.service
The output should be similar to
* pfdi-app.service - Platform Fault Detection Application
    Loaded: loaded (/usr/lib/systemd/system/pfdi-app.service; enabled; preset: enabled)
    Active: active (running) since Mon 2025-06-02 08:37:36 UTC; 3min 18s ago
Invocation: 21933cd70c0346e19f6e0564270c1b20
    Process: 280 ExecStartPre=/usr/sbin/modprobe pfdi_misc (code=exited, status=0/SUCCESS)
    Process: 286 ExecStartPre=/usr/bin/sh -c until [ -e /dev/cpu ]; do sleep 0.5; done (code=exited, status=0/SUCCESS)
  Main PID: 289 (pfdi-sample-app)
      Tasks: 5 (limit: 2265)
    Memory: 980K (peak: 1.4M)
        CPU: 4.119s
    CGroup: /system.slice/pfdi-app.service
            `-289 /usr/bin/pfdi-sample-app -i -c /etc/pfdi/pfdi_test_config_0.pack

Jun 02 08:37:36 fvp-rd-aspen systemd[1]: Starting Platform Fault Detection Application...
Jun 02 08:37:36 fvp-rd-aspen systemd[1]: Started Platform Fault Detection Application.
Jun 02 08:37:36 fvp-rd-aspen pfdi-sample-app[289]: [2025-06-02 08:37:36][info][pid:289][tid:289] libPFDI version: 1.0
Jun 02 08:37:36 fvp-rd-aspen pfdi-sample-app[289]: [2025-06-02 08:37:36][info][pid:289][tid:289] Stub firmware detected - No real diagnostics will be executed
Jun 02 08:37:36 fvp-rd-aspen pfdi-sample-app[289]: [2025-06-02 08:37:36][info][pid:289][tid:289] Firmware reports 41 available diagnostic tests
Jun 02 08:37:36 fvp-rd-aspen pfdi-sample-app[289]: [2025-06-02 08:37:36][info][pid:289][tid:289] Loading config V1.0: running 4 tasks every 60 ms
The PFDI CLI provides a command-line interface for interacting with the Platform Fault Detection Interface.
The tool supports several operations:
Display the user space PFDI library version
Use the following command:
pfdi-cli --info
Expected output:
libPFDI version: 1.0
Display the firmware PFDI library version
Use the following command:
pfdi-cli --pfdi_info <core_id>
<core_id>: Core number to retrieve the version for
Example:
pfdi-cli --pfdi_info 0
Expected output:
Stub firmware detected - No real diagnostics will be executed
Display the number of available PFDI tests
Use the following command:
pfdi-cli --count <core_id>
<core_id>: Core number to retrieve the number of tests for
Example:
pfdi-cli --count 0
Expected output:
CPU0: Firmware reports 41 available diagnostic tests
Retrieve Out-of-Reset (OoR) PFDI tests results
Query the OoR tests results for a specific core:
pfdi-cli --result <core_id>
<core_id>: Core number to retrieve results for
Example:
pfdi-cli --result 0
Expected output:
CPU0: Out of Reset (OoR) test OK
Show usage of pfdi-cli command including function types and error types:
pfdi-cli
Expected output:
Usage: pfdi-cli [options]
  -e, --force_error <cpu> <func> <err>   Inject error
  -p, --pfdi_info <cpu>                  Show PFDI firmware version
  -i, --info                             Show user lib version
  -c, --count <cpu>                      Show PFDI firmware count
  -r, --result <cpu>                     Show OOR result
Functions: INFO,COUNT,RUN,OOR_RESULT,FW_CHECK,FORCE_ERROR
Errors:    COUNT_ZERO,UNKNOWN,NOT_RUN,ERROR,FAULT_FOUND,INVALID_PARAMETERS,NOT_SUPPORTED,SUCCESS
The pfdi-cli--force_error command simulates a platform fault by injecting an error into the firmware
for a specific function on a target core. The injected error is returned on the
next call to the specified function. Note that:
No actual hardware error occurs, this is purely a simulation.
The forced error is automatically cleared after it is reported once by the targeted function.
All function and error ID combinations are permitted, including injecting an error into the
force error function itself.
Platform Fault Detection Interface (PFDI) in Safety Island Cluster 1
The Software Reference Stack currently supports the Platform Fault Detection
Interface on Safety Island Cluster 1. The interface detects hardware faults by
registering firmware test libraries with the framework.
The Software Reference Stack uses dummy PFDI firmware unless you integrate the
Arm Software Test Library (STL). This STL can be integrated as the real PFDI
firmware test backend. To enable STL support and obtain access, contact
Arm or visit Arm Software Test Libraries.
Open the configuration menu:
kas menu arm-zena-css/Kconfig
Select PlatformVariant > RD-AspenCFG2
Select UseCase > ArmAutomotiveSolutionsDemo.
Select Build.
After the build completes, start the FVP and run the Software Reference Stack:
kas shell -c "../layers/meta-arm/scripts/runfvp -t tmux --verbose"
Ensure that the tmux window titled terminal_uart_si_cluster1 is selected.
If not, press Ctrl-bw from the tmux session, navigate to the terminal
terminal_uart_si_cluster1 window and press Enter.
The subsystem module that runs the PFDI in the background starts automatically.
The PFDI Shell provides a command-line interface for interacting with the Platform
Fault Detection Interface. The shell utility supports several operations:
The following boot log appears on the SI CL1 terminal upon successful booting:
Out of Reset (OoR) completed on CPU: 0
*** Booting Zephyr OS build v4.1.0 ***
Out of Reset (OoR) completed on CPU: 1
Secondary CPU core 1 (MPID:0x10100) is up
Out of Reset (OoR) completed on CPU: 2
Secondary CPU core 2 (MPID:0x10200) is up
Out of Reset (OoR) completed on CPU: 3
Secondary CPU core 3 (MPID:0x10300) is up
[00:00:00.000,000] <inf> pfdi_mgmt: PFDI service ready (4 CPUs)
Show usage of pfdi commands:
pfdi
Expected output:
pfdi - Platform Fault Detection Subsystem commands.
       Common argument:
       <cpu> : Logical CPU index (0-based)
       Block model:
       A block is a logical group of related PFDI test cases.
       Each block contains multiple indexed tests.
       <blk_id> selects the block (1-based).
       <start> and <end> select an inclusive test index range
       within the selected block.

Subcommands:
  run          : Execute PFDI tests once.
                 Optional arguments:
                 <blk_id> : Test block ID (1-based)
                 <start>  : Start test index (1-based, inclusive)
                 <end>    : End test index (inclusive, >= <start>)
                 Usage:
                 pfdi run <cpu>
                 pfdi run <cpu> <blk_id>
                 pfdi run <cpu> <blk_id> <start> <end>

  info         : Show firmware meta-data.
                 Usage:
                 pfdi info <cpu>

  count        : Query supported blocks or parts.
                 Optional arguments:
                 <blk_id> : Test block ID (1-based)
                 Usage:
                 pfdi count <cpu>
                 pfdi count <cpu> <blk_id>
                 Behavior:
                 Without <blk_id> : prints number of supported blocks.
                 With <blk_id>    : prints number of parts in the block.

  result       : Show Out-of-Reset (OoR) result.
                 Usage:
                 pfdi result <cpu>

  force-error  : Inject a simulated fault.
                 Usage:
                 pfdi force-error <cpu> <error_id>

  set-status   : Enable or disable periodic execution.
                 Usage:
                 pfdi set-status <cpu> <0|1>
                 Values:
                 0 = disable, 1 = enable

  get-status   : Show periodic execution status.
                 Usage:
                 pfdi get-status <cpu>
Retrieve the status of the PFDI periodic runner:
pfdi get-status <core_id>
<core_id>: Core number to retrieve the status for
Example:
pfdi get-status 0
Expected output:
pfdi: cpu0 running (period: 60 ms)
Enable or disable the PFDI periodic execution:
pfdi set-status <core_id> <state>
<core_id>: Core number to disable or enable.
<state>: State to set for the periodic execution.
Example:
pfdi set-status 0 0
Expected output:
pfdi: cpu0 periodic disabled
pfdi get-status 0
Expected output:
pfdi: cpu0 stopped
pfdi set-status 0 1
Expected output:
pfdi: cpu0 periodic enabled
pfdi get-status 0
Expected output:
pfdi: cpu0 running (period: 60 ms)
Display the firmware PFDI library version
Use the following command:
pfdi info <core_id>
<core_id>: Core number to retrieve the version for
Example:
pfdi info 0
Expected output:
pfdi: cpu0 firmware: stub implementation detected (no vendor library)
Display the number of available PFDI test blocks
Use the following command:
pfdi count <core_id>
<core_id>: Core number to retrieve the number of test blocks for
Example:
pfdi count 0
Expected output:
pfdi: cpu0 supports 11 blocks
Display the number of available PFDI test parts in the blocks
Use the following command:
pfdi count <core_id> <blk_id>
<core_id>: Core number to retrieve the number of test blocks
<blk_id>: Block number to retrieve the number of test parts for
pfdi: run completed: cpu0 all blocks (rc=0)
pfdi: stats: scheduled: 100, success: 100, skipped: 0
Run online PFDI tests for a specific block:
pfdi run <core_id> <blk_id>
<core_id>: Core number to run tests
<blk_id>: Block id to run test for
Example:
pfdi run 0 1
Expected output:
pfdi: run completed: cpu0 block id 1 all parts (rc=0)
pfdi: stats: scheduled: 10, success: 10, skipped: 0
Run online PFDI tests for a specific part range:
pfdi run <core_id> <blk_id> <start> <end>
<core_id>: Core number to run tests
<blk_id> : Block id to run test
<start> : start part index to run test
<end> : end part index to run test for
Example:
pfdi run 0 1 1 2
Expected output:
pfdi: run completed: cpu0 block id 1  part range: 1->2 rc=0
pfdi: stats: scheduled: 2, success: 2, skipped: 0
Force error command to simulate a platform fault by injecting an error into
a target core. The next command that targets the specified core returns the injected error.
Note that:
No actual hardware error occurs, this is purely a simulation.
The forced error is automatically cleared after it is reported once by the targeted core.
All cores and error ID combinations are permitted.
pfdi force-error <core_id> <error_id>
<core_id>: Core number to run tests
<error_id> : Error id to inject for the targeted core
Example:
pfdi force-error 0 -2
Expected output:
pfdi: forced error-id: -2 on cpu0
To confirm the error, run a command that targets the specified core.
The demo demonstrates how to simulate various RAS errors on Cortex-A720AE CPU
cores and how to observe the error handling process via Linux kernel log and
rasdaemon journal.
For DeferredCpuError, the kernel prints the error messages to the
console automatically when the error is injected, so it is expected to
see them even without running dmesg. dmesg is the Linux utility
used to read the kernel log buffer afterwards. Since the messages are
printed live while the shell is still active, the kernel output can
appear mixed with the shell prompt or command output.
Expected output:
Calling ras service to inject DeferredCpuError (error_type=0xB0, comp=0x1, data=0xAABBCCDD)
Call to ras service finished with status: Success
Observe the Linux kernel log.
dmesg
Messages similar to the following should be seen at the end of the kernel
log, and they should have been printed immediately after the error injection
command.
After the command, Primary Compute should stuck immediately due to an
uncontainable error. The error injection command is not able to give the
complete output.
Observe the Safety Island terminal.
The following messages will be displayed in the terminal_uart_si_cluster0.
To shut down the FVP and terminate the emulation, select the terminal titled
python3 where the runfvp was launched by pressing Ctrl-bw and press
Ctrl-c to stop the FVP process.
This demo uses a large random data file which increases the time required in
HTTPS session and amplifies the timing effects of the Arm Cryptographic
Extension.
OpenSSL prints key-generation progress and then prompts for certificate
subject details. The following interaction is expected; press Enter to
accept the defaults or leave fields blank as needed:
Country Name (2 letter code) [AU]:
State or Province Name (full name) [Some-State]:
Locality Name (eg, city) []:
Organization Name (eg, company) [Internet Widgits Pty Ltd]:
Organizational Unit Name (eg, section) []:
Common Name (e.g. server FQDN or YOUR name) []:
Email Address []:
Use the following command to connect the server and download the data file.
OpenSSL involves the Arm Cryptographic Extension for the ciphering algorithm.
time echo -e \
"GET / HTTP/1.1\r\nHost: localhost\r\nConnection: close\r\n\r\n" \
| openssl s_client -connect localhost:4433 -cipher AES256-GCM-SHA384 \
-servername localhost -quiet > /dev/null

Connecting to ::1
depth=0 C=AU, ST=Some-State, O=Internet Widgits Pty Ltd
verify error:num=18:self-signed certificate
verify return:1
depth=0 C=AU, ST=Some-State, O=Internet Widgits Pty Ltd
verify return:1
GET / HTTP/1.1
Host: localhost
Connection: close

real 0m22.478s
user 0m4.325s
sys 0m5.504s
Client side without extension enabled
Use the following command to connect the server and download the data file.
OpenSSL will not involve the Arm Cryptographic Extension for the ciphering
algorithm. OPENSSL_armcap=0x0 disables the usage of Arm Cryptographic
Extension.
Available power profiles:
  - Parking
  - City
  - Highway
To select one of the above profiles, use the -s or --select option.
Set the Parking profile. Run ./mbpp.sh-sParking. This will change
scaling governors to powersave for 0-3 CPUs and power down the rest of
the CPUs. The following logs will appear.
Start the FVP and wait for the Linux login prompt, then log in as root.
At the Linux prompt, run:
echo warm > /sys/kernel/reboot/modereboot
The following logs from the RSE console logs illustrate the Primary Compute
domain reset sequence:
[INF][SCMI] Power state notification received[INF][SCMI] Forceful system power state transition requested[INF] AP SRAM wipe completed[INF] AP BL2: image_loading start[INF] BL2: AP BL2 pre load start[INF] BL2: AP BL2 pre load complete[INF] AP_BL2: image load complete[INF] AP BL2: load+validate succeeded[INF] BL2: AP BL2 post load start[INF] BL2: AP ATU region 0: [0x40000000 - 0x4001ffff]-> [0x20000_d0100000 - 0x20000_d011ffff][INF] BL2: AP ATU region 1: [0x40020000 - 0x4004ffff]-> [0x40000_3b000000 - 0x40000_3b02ffff][INF] BL2: AP ATU region 2: [0x40050000 - 0x4007ffff]-> [0x40000_3b040000 - 0x40000_3b06ffff][INF] BL2: AP ATU region 3: [0x40080000 - 0x400affff]-> [0x40000_3b080000 - 0x40000_3b0affff][INF] BL2: AP ATU region 4: [0x400b0000 - 0x400dffff]-> [0x40000_3b100000 - 0x40000_3b12ffff][INF] BL2: AP ATU region 5: [0x400e0000 - 0x4010ffff]-> [0x40000_3b140000 - 0x40000_3b16ffff][INF] BL2: AP ATU region 6: [0x40110000 - 0x4013ffff]-> [0x40000_3b380000 - 0x40000_3b3affff][INF] BL2: AP ATU region 7: [0x40680000 - 0x406dffff]-> [0x30000_1b600000 - 0x30000_1b65ffff][INF] BL2: AP ATU region 8: [0x40740000 - 0x40741fff]-> [0x20000_60000000 - 0x20000_60001fff][INF] BL2: AP BL2 post load complete[INF][SCMI] Shared memory initialized[INF][SCMI] Warm reset notify: signalling doorbell to SCP[NOT][SCMI] Resetting system (warm) finished
The following logs from the SI CL0 console logs show the handling of the
Primary Compute domain reset request:
[ 1.310656] [SI0 PLATFORM][SCMI] Performing power state notification request[ 1.310671] [SI0 PLATFORM] Powering down CLUS0CORE0[ 1.310678] [SI0 PLATFORM] Powering down CLUS0CORE1[ 1.310687] [SI0 PLATFORM] Powering down CLUS0CORE2[ 1.310695] [SI0 PLATFORM] Powering down CLUS0CORE3[ 1.310703] [SI0 PLATFORM] Powering down CLUS1CORE0[ 1.310711] [SI0 PLATFORM] Powering down CLUS1CORE1[ 1.310719] [SI0 PLATFORM] Powering down CLUS1CORE2[ 1.310728] [SI0 PLATFORM] Powering down CLUS1CORE3[ 1.310735] [SI0 PLATFORM] Powering down CLUS2CORE0[ 1.310744] [SI0 PLATFORM] Powering down CLUS2CORE1[ 1.310752] [SI0 PLATFORM] Powering down CLUS2CORE2[ 1.310760] [SI0 PLATFORM] Powering down CLUS2CORE3[ 1.310769] [SI0 PLATFORM] Powering down CLUS3CORE0[ 1.310777] [SI0 PLATFORM] Powering down CLUS3CORE1[ 1.310785] [SI0 PLATFORM] Powering down CLUS3CORE2[ 1.310793] [SI0 PLATFORM] Powering down CLUS3CORE3[ 1.310806] [SI0 PLATFORM] CLUS0CORE0 not yet powered down[ 1.310817] [SI0 PLATFORM] Notifying RSE and waiting for image load...[ 1.408395] [TRANSPORT] Mailbox ownership error on completer channel 0[ 1.408404] [TRANSPORT] Mailbox ownership error on completer channel 2[ 1.408415] [SI0_PLATFORM] Received doorbell event from RSE[ 1.408424] [SI0 PLATFORM] RSE doorbell received, proceeding with warm reset[ 1.408438] [SI0_PLATFORM] AP-facing SCMI mailboxes reset for warm reboot[ 1.408448] [SI0 PLATFORM] SDS reset syndrome updated successfully[ 1.408458] [SI0 PLATFORM] Warm reset complete. Powering up boot cpu...
After a successful reset, the Linux console becomes available
again and presents the standard login prompt.
Users can log in normally once the login prompt appears.
If the Arm Automotive Solutions Demo for the Virtualization
Architecture is the most recent build, there is no need to rebuild.
For a first-time build, follow the instructions below.
If the FVP has already been launched with the specified build configuration and
is connected to the Primary Compute terminal (running Linux), there is no need
to stop and relaunch. For first-time launch, follow the instructions below.
To start the FVP and connect to the Primary Compute terminal:
kas shell -c "../layers/meta-arm/scripts/runfvp -t tmux --verbose"
Wait for the system to boot and for the Linux prompt to appear, then run:
xl list
Expected output:
Name                                        ID   Mem VCPUs      State   Time(s)
Domain-0                                     0  1024     1     r-----      87.1
domu1                                        1  1024     2     r-----      66.6
domu2                                        2  1024     1     r-----      41.1
The following log entries are expected:
(XEN) d1v0 Unhandled SMC/HVC: 0x8600ff01
(XEN) d1v0: vGICD: RAZ on reserved register offset 0x00000c
(XEN) d1v0: vGICR: SGI: unhandled word write 0x000000ffffffff to ICACTIVER0
ACS tests runs the Base Boot Security
Requirements (BBSR) tests, which enroll the authenticated variables for UEFI
Secure Boot, so running the Linux distros installation after running the ACS
tests will result in a failure. The firmware flash images need to be
recreated with the following command:
kas shell -c "bitbake firmware-fvp-rd-aspen -C deploy"
The manual installation of a Linux distribution requires some manual
interaction, for example, some necessary selections, confirmations or
entering the user and password.
The whole installation process takes a long time (possibly up to 10 hours, or
even longer).
We suggest that when running the Linux distribution installations the FVP is
the only running process as it will consume large amounts of RAM that can make
the system unstable.
See Linux Distributions Installation Tests for an explanation on how
the Linux distros installation is set up and how they work in the Reference
Software Stack.
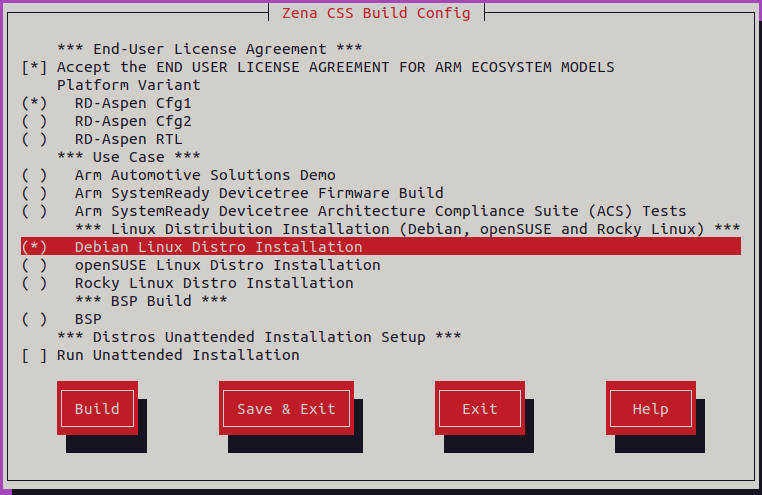
In this test we have modified the installation ISO image to add the preconfiguration file
preseed.cfg inside it. This required editing the grub.cfg file inside the ISO
image to select starting the unattended installation from the preconfiguration file.
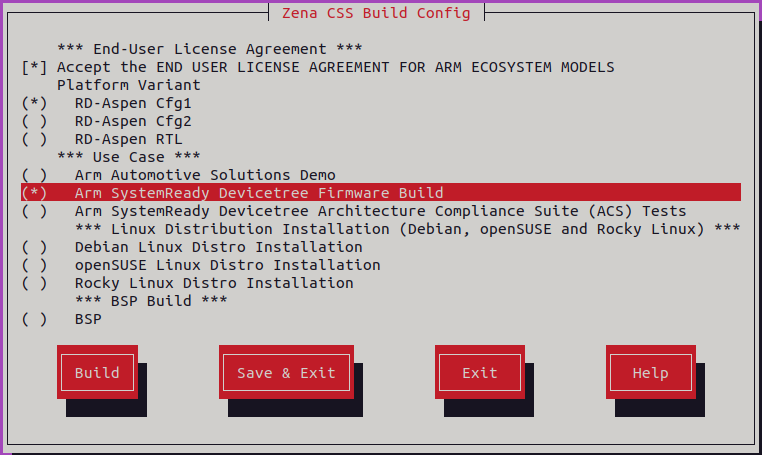
Fig. 5 Arm Zena CSS Build Configuration Menu - Debian Linux Distro Installation
A similar output to the following indicates when the installation is finished, which will take
around 3 hours:
Transitioned to on
Installation status: Scanning installation media...
Installation status: Detecting network hardware...
Installation status: Installing the base system...
Installation status: Installing GRUB...
Installation status: Finishing the installation...
Transitioned to linux
Installation status: Debian installation finished successfully.
Transitioned to off
RESULTS:
RESULTS - arm_systemready_debian_unattended.SystemReadyDebianUnattendedTest.test_debian_unattended: PASSED (5512.47s)
RESULTS - arm_systemready_debian_unattended.SystemReadyDebianUnattendedTest.test_linux_sniff: PASSED (692.62s)
SUMMARY:
arm-systemready-linux-distros-debian () - Ran 2 tests in 6205.086s
arm-systemready-linux-distros-debian - OK - All required tests passed (successes=2, skipped=0, failures=0, errors=0)
Log in
After the installation is finished, run the following command to log
into the Linux shell:
kas shell -c "../layers/meta-arm/scripts/runfvp -t tmux --verbose"
Log into the Linux shell with the user created during the installation
using the username user and the password unsafe.
Note
An SCMI related message may be observed when booting into the operating
system after a successful installation. This message does not indicate
a failure in the installation process or in the installed image. If the
message is displayed before the login prompt, press Enter to return to
the login prompt and continue logging in.
Terminate the FVP
To shut down the FVP and terminate the emulation automatically, run the
following command.
sudo shutdown now
The below message indicates the shutdown process is complete.
reboot: Power down
Subsequently running the FVP will boot into Debian.
Run the following command to start the installation:
kas shell -c "../layers/meta-arm/scripts/runfvp -t tmux --verbose"
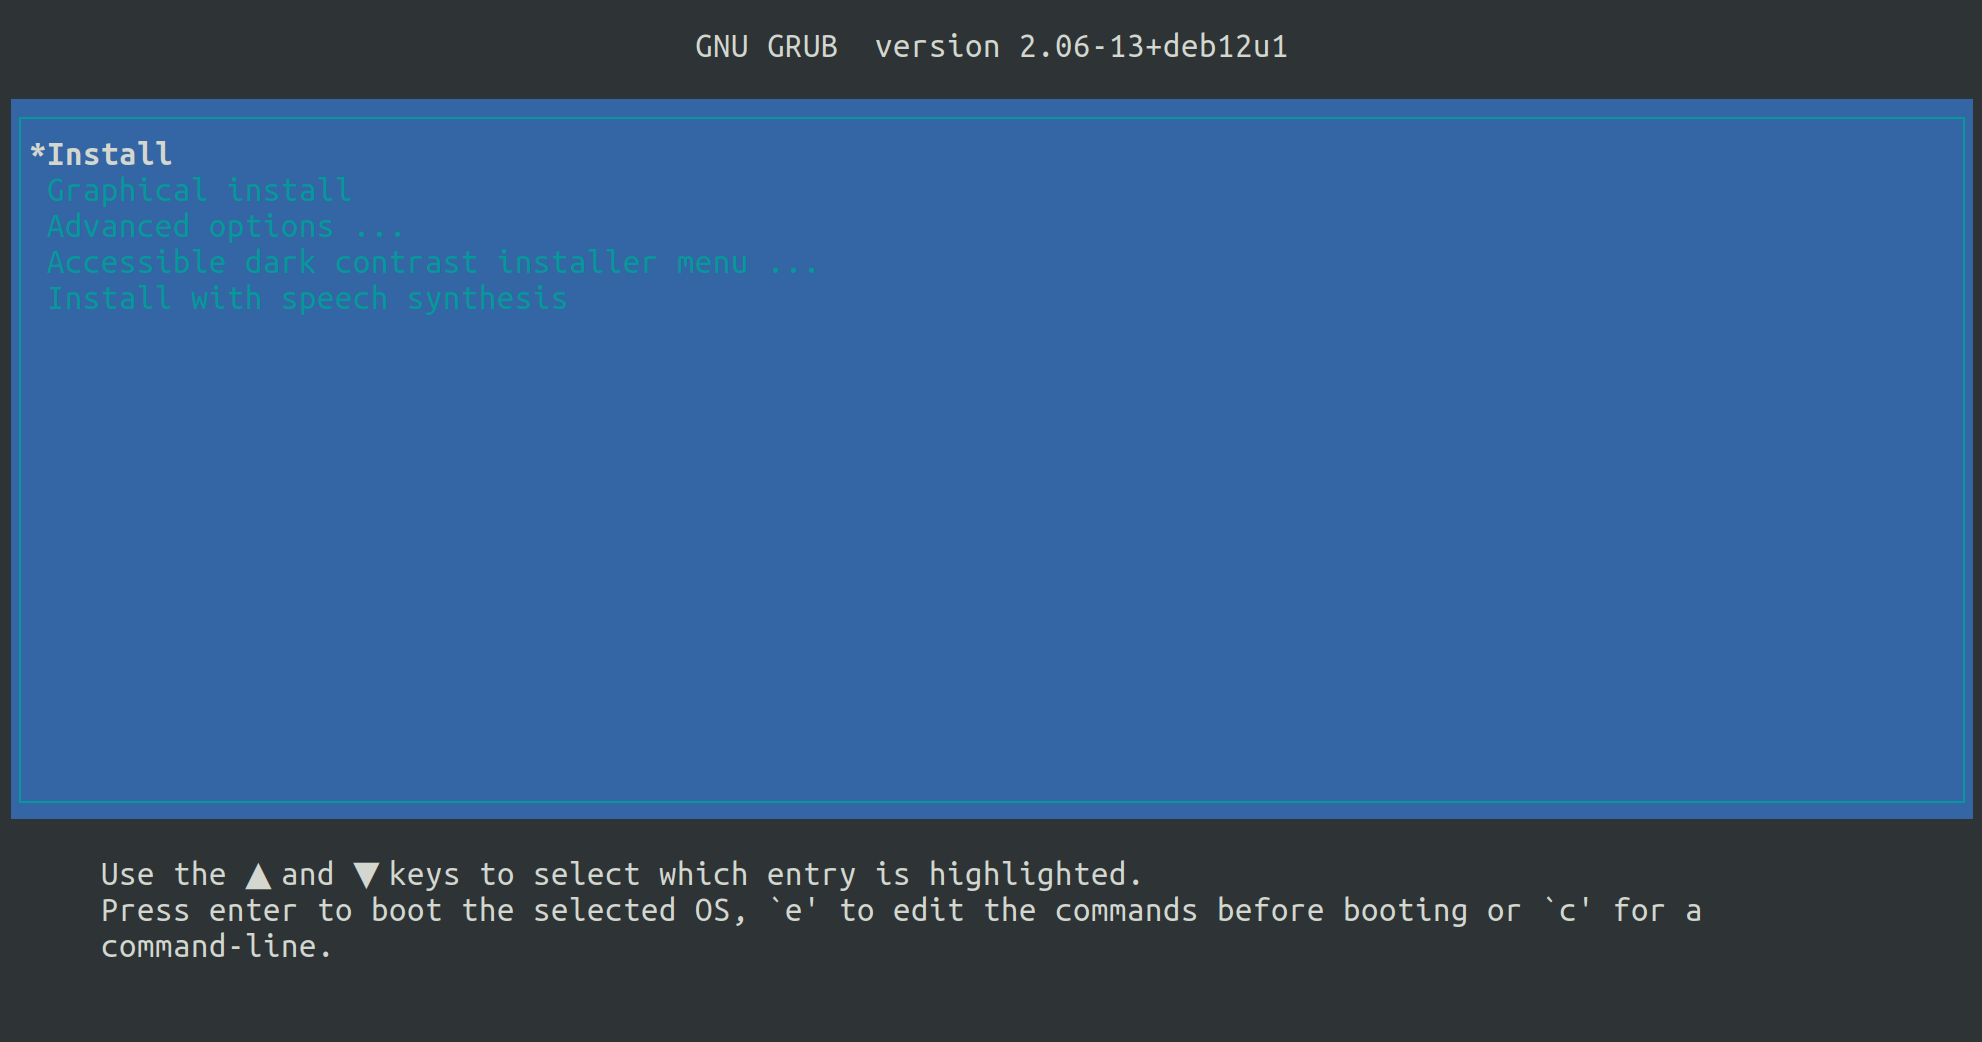
The whole process of installing Debian will probably take about 5 hours. The
installation process begins when you see the following:
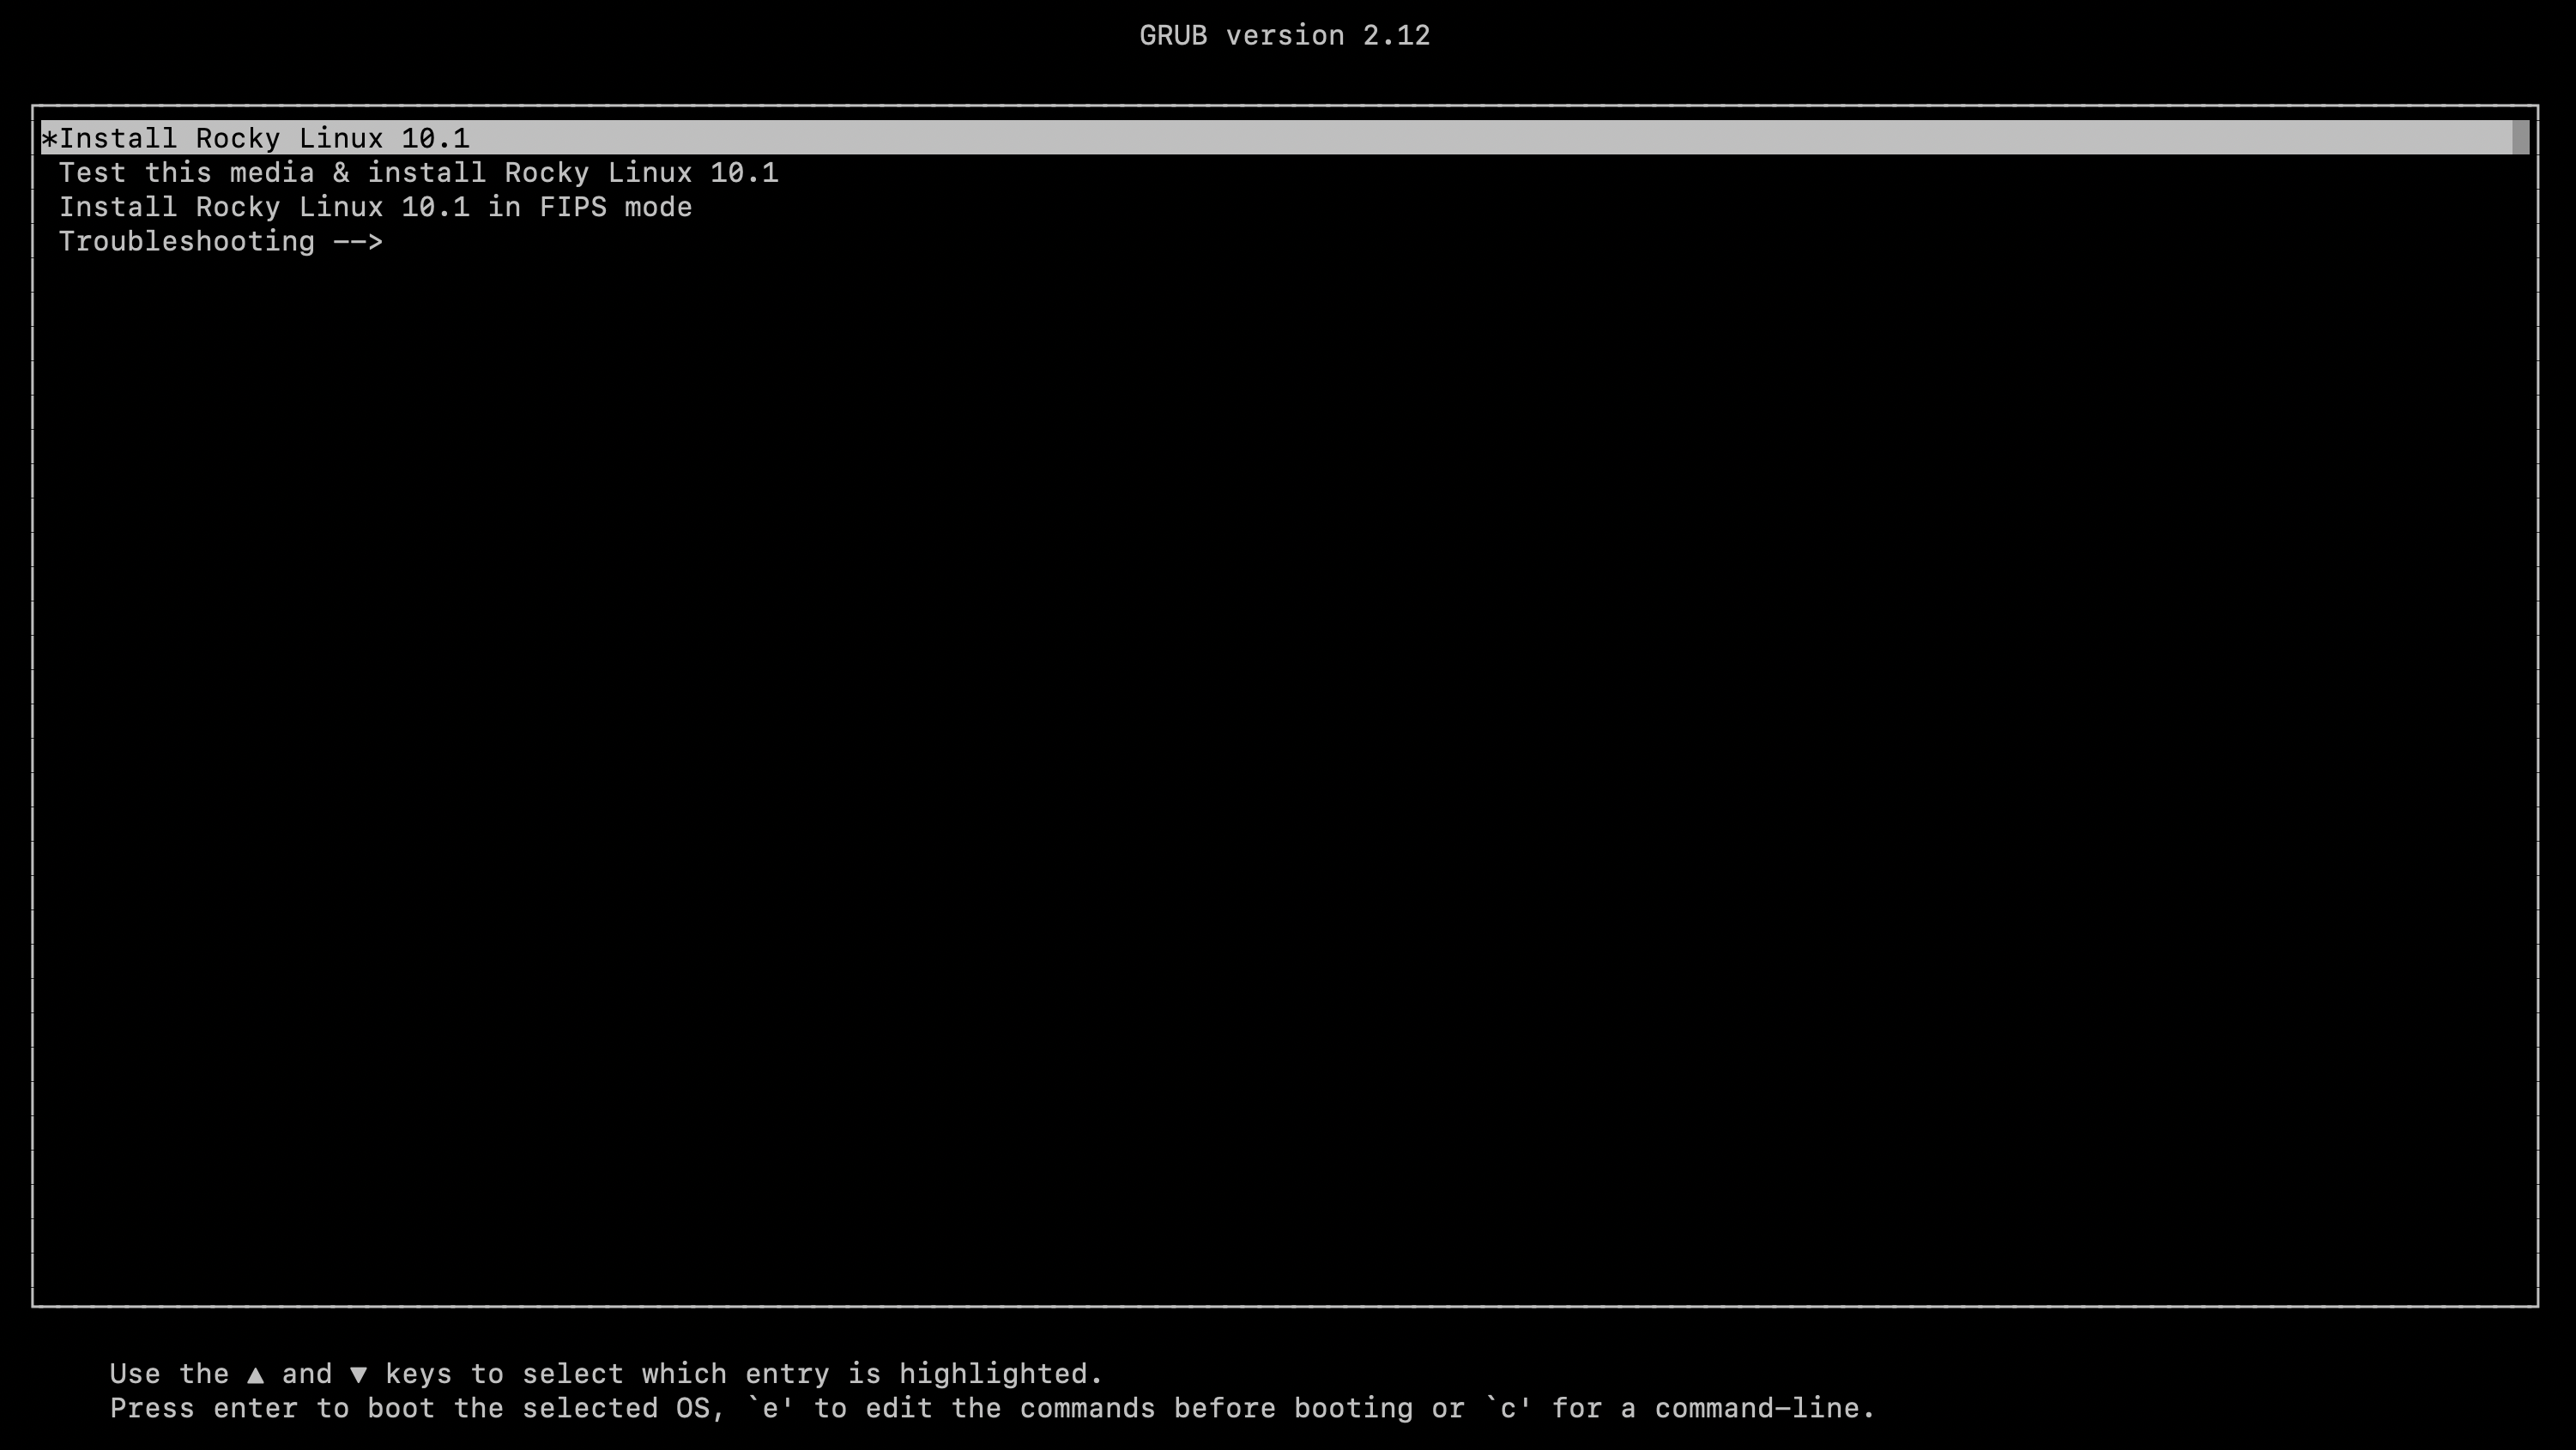
Fig. 7 Grub Install Options Menu - Debian Linux Distro Installation
Select Install to start the installation process. After selecting
Install, a sequence of graphical installer windows is displayed,
prompting for installation preferences. You may choose the
appropriate options in these windows based on your requirements.
For more information, refer to Debian GNU/Linux Installation Guide.
Log in
When the installation reaches the final Finishingtheinstallation
phase, you will need to wait some time to finish the remaining tasks,
and then it will automatically reboot into the installed OS. You can log into
the Linux shell with the user created during installation.
Note
An SCMI related message may be observed when booting into the operating
system after a successful installation. This message does not indicate
a failure in the installation process or in the installed image. If the
message is displayed before the login prompt, press Enter to return to
the login prompt and continue logging in to the operating system.
Terminate the FVP
To shut down the FVP and terminate the emulation automatically, log into the
Linux shell as the root user then run the following command:
shutdown now
The below message shows that the shutdown process is complete:
reboot: Power down
Subsequently running the FVP will boot into Debian.
In this test we have modified the installation ISO image to add the profile
configuration file inside it. This required adding the profile.json file
inside the ISO image to locate the profile configuration file during installation.
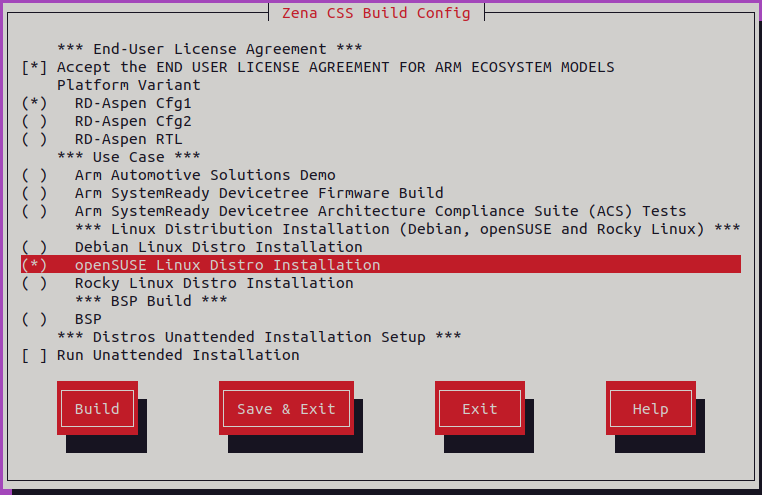
Fig. 8 Arm Zena CSS Build Configuration Menu - openSUSE Linux Distro Installation
This installation will take around 3 hours to complete. A similar output to
the following shows when the installation is finished:
Transitioned to on
Installation status: Loading the kernel, initrd and basic drivers...
Installation status: Agama Installer has successfully booted...
Installation status: Logged into Agama installer as root...
Installation status: JSON profile provided is valid...
Installation status: JSON profile is loaded for installation...
Installation status: Initiating installation...
Installation status: Preparing disks...
Installation status: Installing software...
Installation status: Configuring the system...
Installation status: Finishing the installation...
Transitioned to linux
Installation status: openSUSE installation finished successfully.
Transitioned to off
RESULTS:
RESULTS - arm_systemready_opensuse_unattended.SystemReadyOpenSUSEUnattendedTest.test_linux_sniff: PASSED (107.09s)
RESULTS - arm_systemready_opensuse_unattended.SystemReadyOpenSUSEUnattendedTest.test_opensuse_unattended: PASSED (10064.97s)
SUMMARY:
arm-systemready-linux-distros-opensuse () - Ran 2 tests in 10172.055s
arm-systemready-linux-distros-opensuse - OK - All required tests passed (successes=2, skipped=0, failures=0, errors=0)
Log in
After the installation is finished, run the following command to log
into the Linux shell:
kas shell -c "../layers/meta-arm/scripts/runfvp -t tmux --verbose"
Log into the Linux shell with the user created during the installation
using the username user and the password unsafe.
Terminate the FVP
To shut down the FVP and terminate the emulation automatically, run the
following command:
sudo shutdown now
The below message shows that the shutdown process is complete:
reboot: Power down
Subsequently running the FVP will boot into openSUSE.
Fig. 9 Arm Zena CSS Build Configuration Menu - openSUSE Linux Distro Installation
Run the following command to start the installation:
kas shell -c "../layers/meta-arm/scripts/runfvp -t tmux --verbose"
The whole process of installing openSUSE will take several hours. The install
process begins when you see the following:
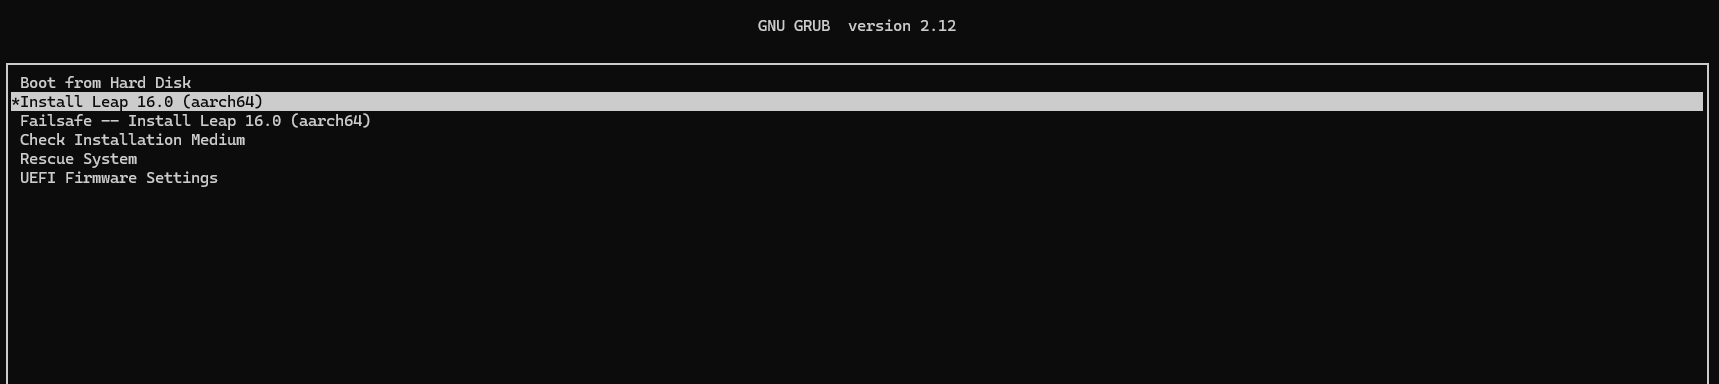
Fig. 10 Agama Installer Options Menu - openSUSE Linux Distro Installation
Select InstallLeap16.0(aarch64) to start the installation process.
Boot Agama installer
When the following message pops up, it means you have successfully booted
into the Agama Installer:
Welcome to Agama Installer
When the login prompt appears, log in as root using the randomly generated
password displayed in the terminal. The appearance of the following message
after login indicates that the installation was successful:
Have a lot of fun...
Configuration profile
You need to create a working configuration profile for installation. Refer to
openSUSE Agama Configuration to understand how to work with
the configuration profiles.
Note
Please provide the relative path with the configuration profile name in below
commands.
Refer to openSUSE Agama Configuration for more information.
Once you have a working configuration profile, execute the following commands
on Agama CLI:
Validate the configuration profile:
agama config validate <PATH_TO_PROFILE>
Load the configuration profile:
agama config load <PATH_TO_PROFILE>
Installation Process
Execute the following commands on Agama CLI:
Start the installation:
agama install
Finish the installation:
agama finish
Log in
When the GRUB menu pops up, select “openSUSE Leap 16.0” to boot into the system.
Log into the Linux shell with the user created via configuration profile.
Terminate the FVP
To shut down the FVP and terminate the emulation automatically, run the
following command:
sudo shutdown now
The below message shows that the shutdown process is complete:
reboot: Power down
Subsequently running the FVP will boot into openSUSE.
In this test we have modified the installation ISO image to add the kickstart
configuration file ks.cfg inside it. This required editing the grub.cfg file inside
the ISO image to locate the kickstart configuration file.
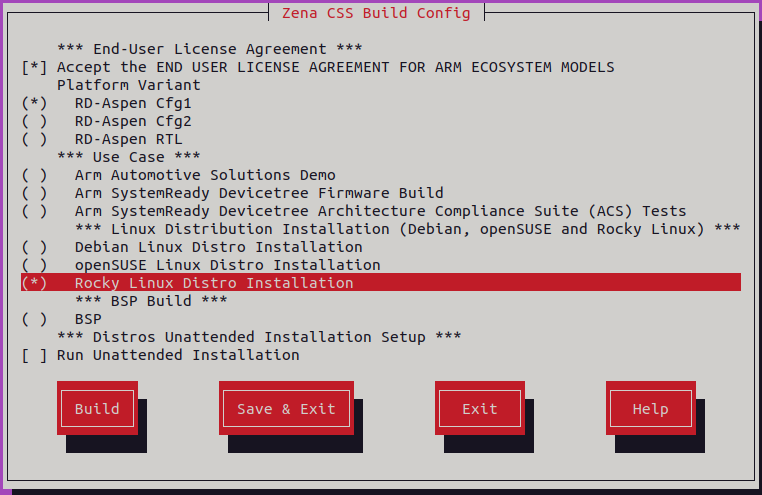
Fig. 11 Arm Zena CSS Build Configuration Menu - Rocky Linux Distro Installation
This installation will take around 8 hours to complete. A similar output to
the following shows when the installation is finished:
Transitioned to on
Transitioned to on
Installation status: Loading the installer, kernel and initrd...
Installation status: Setting up the installation environment...
Installation status: Installing the software packages...
Installation status: Rocky installation finished successfully.
Transitioned to off
RESULTS:
RESULTS - arm_systemready_rocky_unattended.SystemReadyRockyUnattendedTest.test_linux_sniff: PASSED (837.95s)
RESULTS - arm_systemready_rocky_unattended.SystemReadyRockyUnattendedTest.test_rocky_unattended: PASSED (27957.09s)
SUMMARY:
arm-systemready-linux-distros-rocky () - Ran 2 tests in 28795.040s
arm-systemready-linux-distros-rocky - OK - All required tests passed (successes=2, skipped=0, failures=0, errors=0)
Log in
After the installation is finished, run the following command to log
into the Linux shell:
kas shell -c "../layers/meta-arm/scripts/runfvp -t tmux --verbose"
Log into the Linux shell with the user created during the installation
using the username user and the password unsafe.
Terminate the FVP
To shut down the FVP and terminate the emulation automatically, run the
following command:
sudo shutdown now
The below message shows that the shutdown process is complete:
reboot: Power down
Subsequently running the FVP will boot into Rocky Linux.
Run the following command to start the installation:
kas shell -c "../layers/meta-arm/scripts/runfvp -t tmux --verbose"
The whole process of installing Rocky Linux will probably take about 12 hours. The
installation process begins when you see the following:
Fig. 13 Grub Install Options Menu - Rocky Linux Distro Installation
Select InstallRockyLinux10.1 to start the installation process.
Here are some tips for installing Rocky Linux:
It will take a few minutes for GRUB to load the installer, kernel and initrd.
When the installer has started, enter 2 to choose Usetextmode.
Starting installer, one moment...
libreport is not available in this environment - bug reporting disabled
anaconda 40.22.3.33-1.el10.rocky.0.3 for Rocky Linux 10.1 started.
 * installation log files are stored in /tmp during the installation
 * shell is available on TTY2 and in second TMUX pane (ctrl+b, then press 2)
 * when reporting a bug add logs from /tmp as separate text/plain attachments

Wayland did not start in the expected time, falling back to text mode.
 There are multiple ways to avoid this issue:
 * Do not load the stage2 image over a slow network link.
 * Wait longer for Wayland startup with the inst.xtimeout=<SECONDS> boot option.The default is 60 seconds.
 * Load the stage2 image into memory with the rd.live.ram boot option to decrease access time.
 * Enforce text mode when installing from remote media with the inst.text boot option.
================================================================================
================================================================================
Wayland was unable to start on your machine. Would you like to start an RDP
session to connect to this computer from another computer and perform a
graphical installation or continue with a text mode installation?

1) Use graphical mode via Remote Desktop Protocol
2) Use text mode

Please make a selection from the above ['c' to continue, 'q' to quit, 'r' to
refresh]: 2
Note
The startup warning shown above may vary depending on the graphical
interface used on the system. Messages may be related to X11, Wayland,
or graphical environment startup. The first option presented may also
vary depending on the graphical interface. The exact graphical message is
not important for this step; simply select text mode.
For more information about Wayland, visit the
Wayland website.
When reaching the installation menu, you will see several items marked as !
which shows that the item needs to be configured before proceeding.
================================================================================
================================================================================
Installation

1) [x] Language settings                 2) [x] Time settings
       (English (United States))                (America/Chicago timezone)
3) [!] Installation source               4) [!] Software selection
       (Setting up installation                 (Processing...)
       source...)
5) [!] Installation Destination          6) [x] Kdump
       (Processing...)                          (Kdump is enabled)
7) [x] Network configuration             8) [!] Root password
       (Connected: eth0)                        (Root account is disabled)
9) [!] User creation
       (No user will be created)

Please make a selection from the above ['b' to begin installation, 'h' to help,
'q' to quit, 'r' to refresh]:
For 3)[!]Installationsource, enter 3, then 1 to select
CD/DVD.
================================================================================
================================================================================
Installation source

Choose an installation source type.
1) CD/DVD
2) local ISO file
3) Network

Please make a selection from the above ['c' to continue, 'h' to help, 'q' to
quit, 'r' to refresh]: 1
For 4)[!]Softwareselection, enter 4, then c to continue.
For 5)[!]InstallationDestination, enter 5, then c to select
the default options.
For 8)[!]Rootpassword, follow the prompts to enter the password and
confirm.
After entering root password, 9)[]Usercreation becomes optional and
can be skipped.
The final configuration will appear as follows:
================================================================================
================================================================================
Installation

1) [x] Language settings                 2) [x] Time settings
       (English (United States))                (America/Chicago timezone)
3) [x] Installation source               4) [x] Software selection
       (Local media)                            (Minimal Install)
5) [x] Installation Destination          6) [x] Kdump
       (Automatic partitioning                  (Kdump is enabled)
       selected)
7) [x] Network configuration             8) [x] Root password
       (Connected: eth0)                        (Root password is set)
9) [ ] User creation
       (No user will be created)

Please make a selection from the above ['b' to begin installation, 'h' to help,
'q' to quit, 'r' to refresh]:
Now enter b to start the installation.
The installer is expected to stay at Configuringkernel-core.aarch64
for several hours. The installer will then verify the installed packages
and continue to install the boot loader.
The following error is expected while installing the boot loader. Ignore the
error by responding yes and continue.
Installing boot loader
================================================================================
================================================================================
Question

The following error occurred while installing the boot loader. The system will
not be bootable. Would you like to ignore this and continue with installation?

Failed to set new efi boot target. This is most likely a kernel or firmware bug.

Please respond 'yes' or 'no': yes

[anaconda]1:main* 2:shell  3:log  4:storage-log >Switch tab: Alt+Tab | Help: F1
Log in
When the installation reaches the final Finishingtheinstallation
phase, you will need to wait some time to finish the remaining tasks.
When you see the message Installationcomplete.PressENTERtoquit:,
press enter to reboot into the installed OS. You can log into
the Linux shell with the user created during installation.
Terminate the FVP
To shut down the FVP and terminate the emulation automatically, log into the
Linux shell as the root user then run the following command:
shutdown now
The below message shows that the shutdown process is complete:
reboot: Power down
Subsequently running the FVP will boot into Rocky Linux.
The firmware images listed below can be found in the directory
build/tmp_systemready/deploy/images/fvp-rd-aspen/:
ap-flash-image.img
combined_provisioning_message.bin
rse-flash-image.img
rse-otp-image.img
rse-rom-image.img
Arm SystemReady Devicetree Architecture Compliance Suite (ACS) tests
The ACS for the Arm SystemReady Devicetree compliance is delivered through a
live OS image, which enables the basic automation to run the tests.
The system boots with the ACS live OS image and the ACS tests run
automatically after the system boots. See
ACS tests for more details.
Note
For a full SR compliance report on the Reference Software Stack, the Debian,
openSUSE, and Rocky unattended installation use cases must be run before the
ACS tests. You should not delete or modify the build directory between the
unattended installations and the ACS tests, otherwise the results for SR
compliance will be inaccurate. If either unattended installation is run
multiple times, only the results from the most recent installation will
be considered. See
ACS tests for more information.
NOTE: Executing Tasks
Creating terminal default on terminal_ns_uart0
Creating terminal tf-a on terminal_sec_uart
Creating terminal rse on terminal_uart
Creating terminal safety_island_c0 on terminal_uart_si_cluster0
Transitioned to on
Test Group (PlatformSpecificElements): FAILED
Test Group (RequiredElements): FAILED
Test Group (CheckEvent_Conf): PASSED
Test Group (CheckEvent_Func): PASSED
Test Group (CloseEvent_Func): PASSED
Test Group (CreateEventEx_Conf): PASSED
Test Group (CreateEventEx_Func): PASSED
Test Group (CreateEvent_Conf): PASSED
Test Group (CreateEvent_Func): PASSED
Test Group (RaiseTPL_Func): PASSED
...
...
ACS BBSR running
Test Group (VariableAttributes): PASSED WITH WARNINGS
Test Group (VariableUpdates): PASSED
...
Test Group (virtio_blk virtio1): vda
Test Group (virtio_blk virtio2): vdb
Test Group (virtio_blk virtio3): vdc
Test Group (virtio_blk virtio4): vdd
Linux tests complete
Transitioned to off
RESULTS:
RESULTS - arm_systemready_devicetree_acs.SystemReadyACSTest.test_acs: PASSED (9258.72s)
SUMMARY:
arm-systemready-devicetree-acs () - Ran 1 test in 9258.723s
arm-systemready-devicetree-acs - OK - All required tests passed (successes=1, skipped=0, failures=0, errors=0)
As seen in the above logs, some Test Groups are expected to fail. The following
message is expected to validate this use case:
Running the ACS tests more than once will have them resume from where they
last stopped. Additionally, consecutive runs are not supported by the ACS
logs; it will result in a failure after the end of the tests.
To run the ACS tests again, use the following to refresh the firmware
images in flash and re-start the entire ACS test suite properly:
The ACS tests take hours to complete. The actual time taken will vary
depending on the performance of the build host. The default timeout setting
for the tests is 12 hours for an x86_64 host or 24 hours for an aarch64 host.
If a timeout failure occurs, increase the timeout setting and re-run
the tests with the following command on the build host terminal. The example
command below changes the timeout setting to 16 hours:
TEST_OVERALL_TIMEOUT="\${@16*60*60}" kas shell -c "bitbake arm-systemready-devicetree-acs -C unpack"
Note
There is a rare known failure where a timeout might occur during test execution.
See ACS tests for an explanation on how the
ACS tests are set up and how they work in the Reference Software Stack.
Heterogeneous Inter-Processor Communication (HIPC) Demo
The HIPC demo validates the networking implementation between the Primary
Compute and Safety Island Cluster 1 (SI CL1), following the design described in
Heterogeneous Inter-Processor Communication (HIPC).
Run the following command on Safety Island CL1 (Zephyr) to start the UDP
server:
zperf udp download
The output shows that the UDP server starts and listens on port 5001.
UDP server started on port 5001
Run the following command on Primary Compute (Linux) to send UDP traffic:
Use the iperf tool to send UDP traffic. The -u option enables UDP
mode, and the command sends data to 192.168.1.1 on port 5001 for 3
seconds, with a packet size of 1438bytes and a target bandwidth of
100Kbps.
iperf -u -c 192.168.1.1 -t 3 -b 100K -l 1438 -P 1
The output shows that the UDP packets are transmitted successfully with no
packet loss.
------------------------------------------------------------
Client connecting to 192.168.1.1, UDP port 5001
Sending 1438 byte datagrams, IPG target: 0.00 us (kalman adjust)
UDP buffer size:  208 KByte (default)
------------------------------------------------------------
[  1] local 192.168.1.2 port 60661 connected with 192.168.1.1 port 5001
[ ID] Interval       Transfer     Bandwidth
[  1] 0.00-3.15 sec  40.7 KBytes   106 Kbits/sec
[  1] Sent 30 datagrams
[  1] Server Report:
[ ID] Interval       Transfer     Bandwidth        Jitter   Lost/Total Datagrams
[  1] 0.00-3.94 sec  39.3 KBytes  81.8 Kbits/sec   0.000 ms 0/28 (0%)
Run the following command on Safety Island CL1 (Zephyr) to stop the UDP
server:
zperf udp download stop
The output shows that the UDP server stops successfully.
Run the following command on Primary Compute (Linux) to start the UDP server:
iperf -u -s -P 1
The output shows that the server listens on port 5001.
------------------------------------------------------------
Server listening on UDP port 5001
UDP buffer size:  208 KByte (default)
Run the following command on Safety Island CL1 (Zephyr) to send UDP traffic:
Use the zperf tool to send UDP traffic. The udpupload command runs
in client mode and sends data to 192.168.1.2 on port 5001 for 3
seconds, with a packet size of 1KB and a target bandwidth of
100Kbps.
zperf udp upload 192.168.1.2 5001 3 1k 100K
The output shows that the UDP data is transmitted successfully with no packet
loss.
Remote port is 5001
Connecting to 192.168.1.2
Duration:       3.00 s
Packet size:    1000 bytes
Rate:           100 kbps
Starting...
Rate:           100 Kbps
Packet duration 78 ms
-
Upload completed!
Statistics:             server  (client)
Duration:               2.43 s  (3.13 s)
Num packets:            39      (39)
Num packets out order:  0
Num packets lost:       0
Jitter:                 10.10 ms
Rate:                   128 Kbps        (99 Kbps)
Meanwhile, on the Primary Compute terminal, the following traffic information
will be seen:
------------------------------------------------------------
[  1] local 192.168.1.2 port 5001 connected with 192.168.1.1 port 41418
[ ID] Interval       Transfer     Bandwidth        Jitter   Lost/Total Datagrams
[  1] 0.00-2.43 sec  38.1 KBytes   128 Kbits/sec  10.109 ms 0/39 (0%)
Run the following command on Safety Island CL1 (Zephyr) to start the TCP
server:
zperf tcp download
The output shows that the TCP server starts and listens on port 5001.
TCP server started on port 5001
Run the following command on Primary Compute (Linux) to send TCP traffic:
Use the iperf tool on Linux to send TCP traffic. In this command,
-c192.168.1.1 specifies the destination IP address (server), -t1
sets the test duration to 1 second, and -P1 runs a single parallel
stream.
iperf -c 192.168.1.1 -t 1 -P 1
The output shows that a TCP connection is established and data is transferred
successfully.
------------------------------------------------------------
Client connecting to 192.168.1.1, TCP port 5001
TCP window size: 16.0 KByte (default)
------------------------------------------------------------
[  1] local 192.168.1.2 port 33418 connected with 192.168.1.1 port 5001
[ ID] Interval       Transfer     Bandwidth
[  1] 0.00-1.00 sec   108 MBytes   906 Mbits/sec
Note
The TCP test can take a few minutes to complete.
Run the following command on Safety Island CL1 (Zephyr) to stop the TCP
server:
zperf tcp download stop
The output shows that the TCP server stops successfully.
Run the following command on Primary Compute (Linux) to start the TCP
server:
iperf -s -P 1
The output shows that the server listens on port 5001.
------------------------------------------------------------
Server listening on TCP port 5001
TCP window size:  128 KByte (default)
------------------------------------------------------------
[  1] local 192.168.1.2 port 5001 connected with 192.168.1.1 port 35099
[ ID] Interval       Transfer     Bandwidth
[  1] 0.00-0.80 sec  41.5 MBytes   436 Mbits/sec
Run the following command on Safety Island CL1 (Zephyr) to send TCP traffic:
Use the zperf tool to send TCP traffic. The tcpupload command runs
in client mode and sends data to 192.168.1.2 on port 5001 for 1
second, with a packet size of 1KB.
zperf tcp upload 192.168.1.2 5001 1 1k
The output shows that the TCP data transfer completes successfully with no
errors.
Remote port is 5001
Connecting to 192.168.1.2
Duration:       1.00 s
Packet size:    1000 bytes
Rate:           10 kbps
Starting...
-
Upload completed!
Duration:       1.00 s
Num packets:    43508
Num errors:     0 (retry or fail)
Rate:           348.06 Mbps
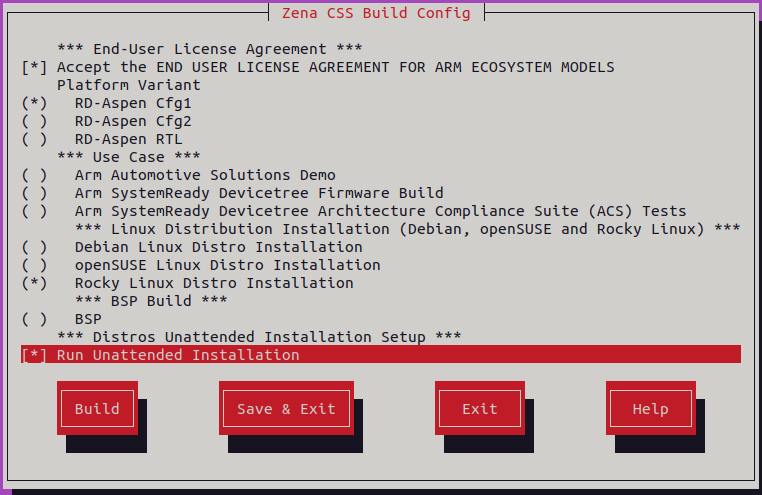
When automated validation runs with RD-Aspen CFG1, all Safety Island Cluster 1
related tests are skipped; as a result, the Baremetal, Virtualization, and BSP
suites are smaller than in CFG2, which includes those Safety Island Cluster 1
checks. For example,
test_10_safety_island.SafetyIslandTestBase.test_cluster1 and
test_00_aspen_boot.AspenBootTest.test_safety_island_cl1 will not be
executed in RD-Aspen CFG1 config.
Secure Firmware Update (Secure FWU) is a mechanism implemented in the Reference
Software Stack to provide a means for securely updating firmware images. In
RD-Aspen Secure FWU is demonstrated via the capsule-on-disk case.
The capsule for testing will be generated together with the image for the
software stack when building. The capsule-on-disk update is supported for both
baremetal and virtualization architectures in the software stack.
To run the configuration menu:
kas menu arm-zena-css/Kconfig
To build a Baremetal Architecture image:
Select ArmAutomotiveSolutionsDemo from the Use-Case menu.
Select Baremetal from the ReferenceSoftwareStackArchitecture
menu. Choose the option from the PlatformVariant as appropriate; either
is supported.
Select Build.
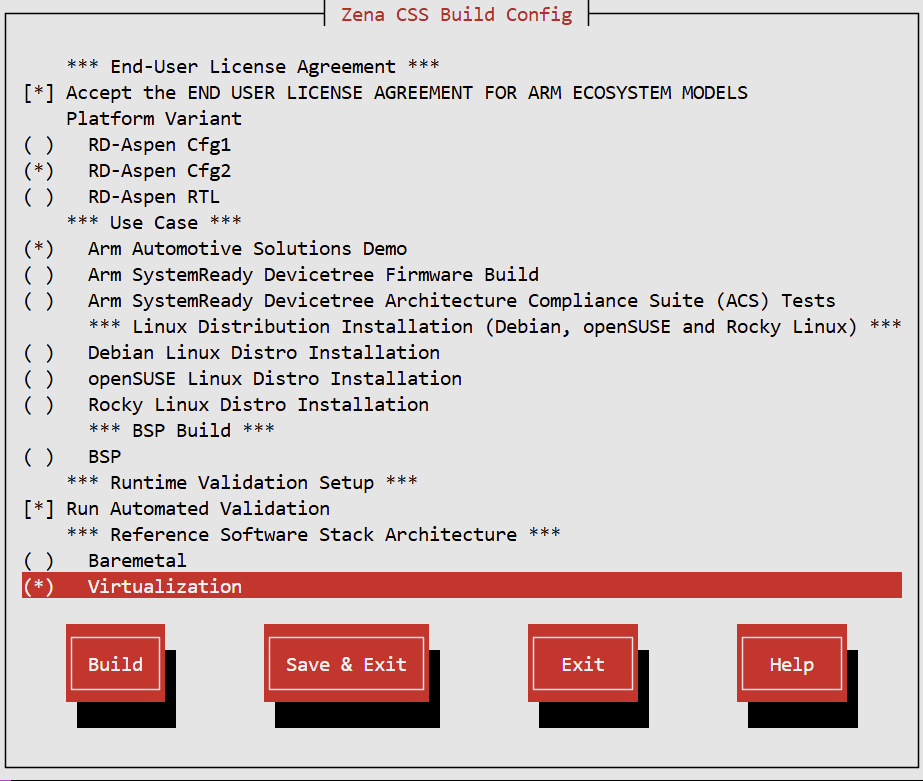
To build a Virtualization Architecture image:
Select ArmAutomotiveSolutionsDemo from the Use-Case menu.
menu. Choose the option from the PlatformVariant as appropriate; either
is supported.
Select Virtualization from the ReferenceSoftwareStackArchitecture
menu.
After the build is finished, run the following command to start the FVP and run
the software reference stack:
kas shell -c "../layers/meta-arm/scripts/runfvp -t tmux --verbose"
Log into the Linux shell with the username root without password.
Run the below command to guarantee that all the expected services have been
initialized.
systemctl is-system-running --wait
Wait for it to return. The expected terminal output is running.
To start the Secure FWU, run the following commands to create
the EFI/UpdateCapsule directory and copy the capsule into it.
root@fvp-rd-aspen:~# mount /dev/vda1 /boot
root@fvp-rd-aspen:~# mount /dev/vdb1 /mnt
root@fvp-rd-aspen:~# mkdir -p /boot/EFI/UpdateCapsule
root@fvp-rd-aspen:~# cp -rf /mnt/fw.cap /boot/EFI/UpdateCapsule/
Reboot the system to apply update.
root@fvp-rd-aspen:~# reboot
U-Boot will automatically detect and apply the capsule after the system
reboots. The following U-Boot logs indicate that the upgrade process has
started and is in progress. The option selected in PlatformVariant
menu, corresponds to following difference in logs.
It can take a few minutes while the payloads are being updated.
After the capsule is applied, the system will reboot and attempt to boot
with the updated firmware images.
Check the terminal logs of RSE-terminal_uart to confirm RSE is
booting with the update bank 1:
[INF] Starting TF-M BL1_1
[INF] Jumping to BL1_2
[INF] Starting TF-M BL1_2
[INF] Attempting to boot image 1
Check the logs of PCSecureConsole-terminal_sec_uart. TF-A BL2 loads
new images from the update bank FIP_B:
INFO: Booting with partition FIP_B
In PCConsole-terminal_ns_uart0 U-Boot logs will show that system is
now booting in Trial state:
FWU: System booting in Trial State
FWU: ABI version 1.0 detected
The new images are accepted by U-Boot and then the system eventually boots
into Linux.
After the entire FVP boot-to-Linux process completes, reset the whole system again.
root@fvp-rd-aspen:~# reboot
In PCConsole-terminal_ns_uart0 the following logs show that U-Boot
detects images booting in Regular state after the reboot.
FWU: System booting in Regular State
FWU: ABI version 1.0 detected
Check RSE-terminal_uart logs again to see it uses same image bank
after reboot which indicates that the upgrade was successful and the system
has successfully rebooted with the updated firmware:
[INF] Starting TF-M BL1_1
[INF] Jumping to BL1_2
[INF] Starting TF-M BL1_2
[INF] Attempting to boot image 1
Similarly, PCSecureConsole-terminal_sec_uart logs show that TF-A
BL2 uses new image persistently from FIP_B:
The Software Reference Stack enables builds for the Arm Zena CSS Cfg0 RTL.
Currently, the Board Support Package (BSP) use case is the only one available.
It provides the minimal functionality required to boot into a Linux shell.
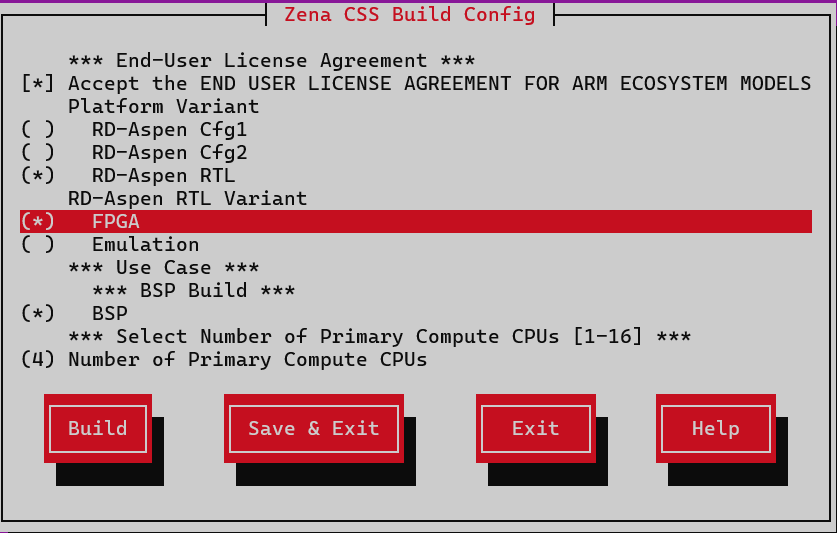
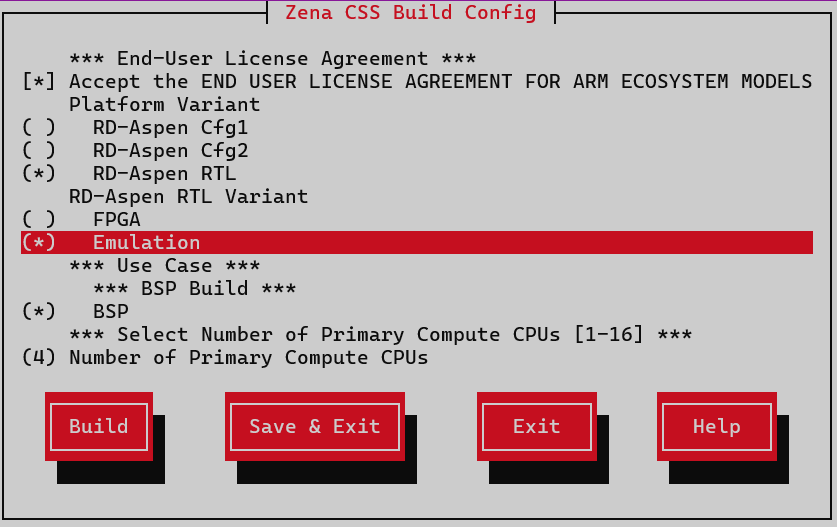
RTL variants supported are ‘Emulation’ and ‘FPGA’.
Note
RTL builds are intended for execution on real hardware. Do not attempt to
run RTL builds on FVP.
RTL variants are supported for ARM’s internal hardware options - ‘Emulation’ and ‘FPGA’.
Please contact Arm for more information regarding RTL platforms.